Story update: October 23, 2015
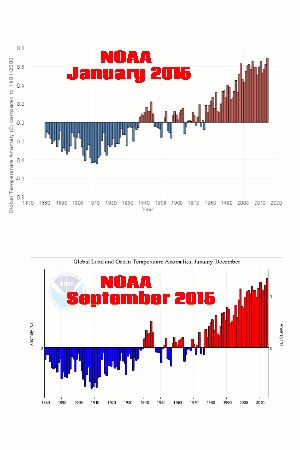
Yesterday I showed how NASA has doubled their own reported global warming since 1999
1999 Figure 1: Global annual-mean surface air temperature change based on the meteorological station network.
2015 Version: traditional analysis using only meteorological station data
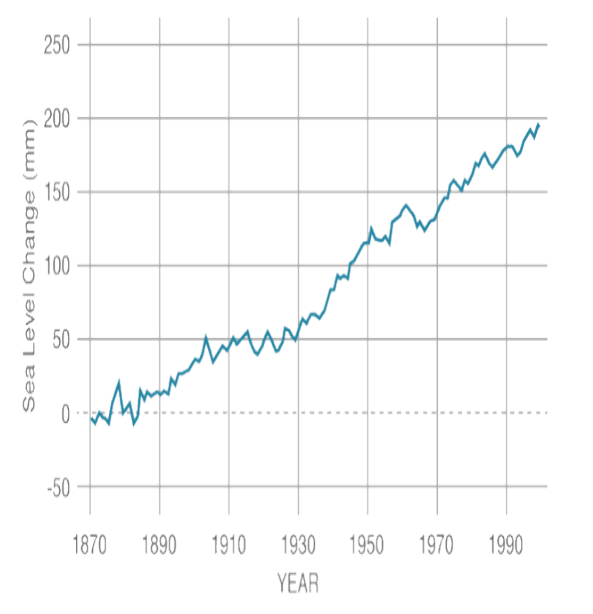
That is pretty spectacular fraud, and they have done exactly the same thing with their sea level data since 1982. NASA currently shows 16 cm of sea level rise from 1880 to 1980, and no change in rates over time
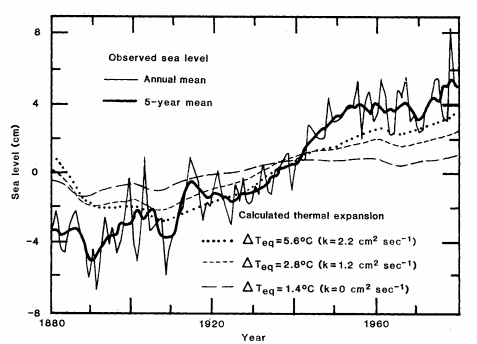
But in 1982, NASA only showed 8 cm of sea level rise from 1880 to 1980, and a sharp flattening to almost zero after 1950.
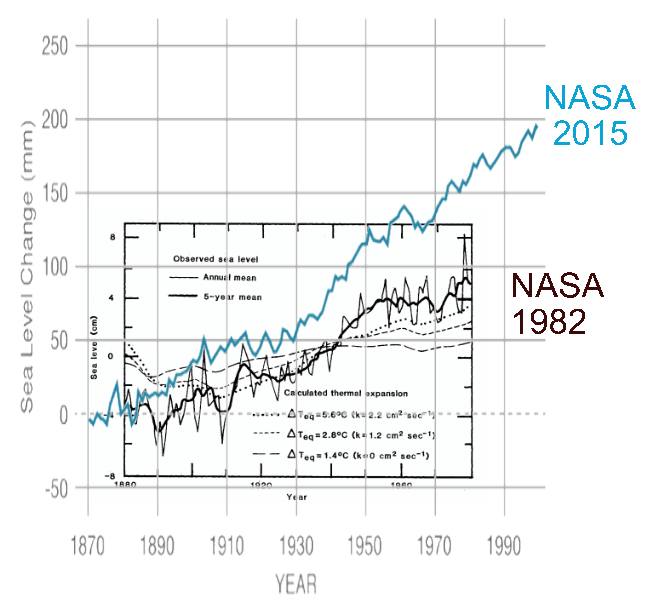
The next graph is an overlay of the two above, normalized to 1880.
NASA’s current graph looks nothing like their 1982 graph, doubling sea level rise. Exactly the same thing they have done with temperature…
View original post 1 more word


here is what hearts NASA a lot, they received the text of this post 8 months ago – ask them; ”why are they hiding under their rock”?!::: https://globalwarmingdenier.wordpress.com/venus-runaway-greenhouse-con/
LikeLike